The stellar nursery:

forming stars and planets

This project is an interdisciplinary collaboration between our team of star and planet formation scientists at the University of Dundee, the UK artist duo Semiconductor and Adam Lockhart, Lecturer (T&R) in Media Art & Archives at Duncan of Jordanstone College of Art and Design (DJCAD). Our aim is to use art as a vehicle to communicate scientific processes behind the technique of time-resolved spectroscopy to a broader public, encouraging them to think and wonder about the capabilities of mapping what is nearly invisible, and to raise awareness in science communities about what art-science collaborations can achieve.  

The formation of stars and planets is one of the most captivating themes for the general public, but studying baby stars and new-born planets is not easy,  and it requires observing techniques beyond direct imaging. While the results of planet-related projects are often publicised, the way scientists reach these conclusions and overcome the experimental difficulties of the task is another adventure of its own but tends to remain unknown for the general public.

Our collaboration between scientists and artists is using art to capture this scientific process and bring it to sectors of the public that may not be addressed by pure STEM activities. We started using dedicated public engagement funds from the STFC Consolidated Grant The Planet-Disk Connection (ST/S000399/1) to produce bespoke artworks inspired by and based on our research field, mapping the surroundings of young stars and forming planets, later expanded thanks to the SPARK Public Engagement grant Reading between the lines: Translating light from science to art (ST/V002058/1). 

Here you can follow our voyage to use light and time to map the space around young, forming stars.

Spectral Constellations

We are delighted to announce the completion of Spectral Constellations, which made its debut at the NEoN Digital Arts festival in Dundee. It consists of a series of generative animations, driven by scientific data of young stars. This data, collected by scientists using a method called Spectroscopy, creates an understanding of structures around distant young stars, where gas and dust come together to form planets. Scientists study the light this matter emits using prisms to split it into its constituent wavelengths, revealing its elemental make-up. By analysing this data over time, spatial formations of the matter can be decoded.

Semiconductor have worked with this spectral data as a physical material, translating it into rings of light which resemble the gradiated discs of planetary and stellar formations. As the data ebbs and flows it introduces a sense of form and motion, waveforms merge and interfere revealing patterns and rhythms, and engage our human tendency towards pattern recognition. The fragmented LED mosaics provide partial windows from which the spectral data shifts and shimmers to create a raw visual experience.

About the Artists:

Semiconductor is UK artist duo Ruth Jarman and Joe Gerhardt. For over twenty years they have been making visually and intellectually engaging artworks which explore the material nature of our world and how we experience it through the lenses of science and technology, as a way to explore the limits of human perception and reflect on how we experience the world. Recent projects include HALO, a large-scale immersive artwork which embodies data collected at the world’s largest experiment at CERN, the European Laboratory for Particle Physics and Earthworks a five-channel computer generated animation, which creates an immersive experience of the phenomena of landscape formation, through the scientific and technological devices that are used to study it. www.semiconductorfilms.com

ARTWORK BLOG

The STAR-MELT paper that the scientists have written on the software they have developed to study emission lines of young stellar objects (which has just been accepted for publishing) has been great for helping to consolidate and reinforce our research, focusing in on what’s important in their endeavour and describing the technicalities of how they work with the data they collect. It has also introduced a new way of working with the data over time, which we are still getting our heads around in terms of what it actually represents in this form, as the data originates as snapshots. This seems to be the way to move forward. We are working to understand how the information they collect has been interpreted and what it now represents. We have also acquired some of this data and are going through the process of investigating it as a physical material to work with it as light and time, in the form of animation. 

Semiconductor Page Sm

Semiconductor WIP Sm

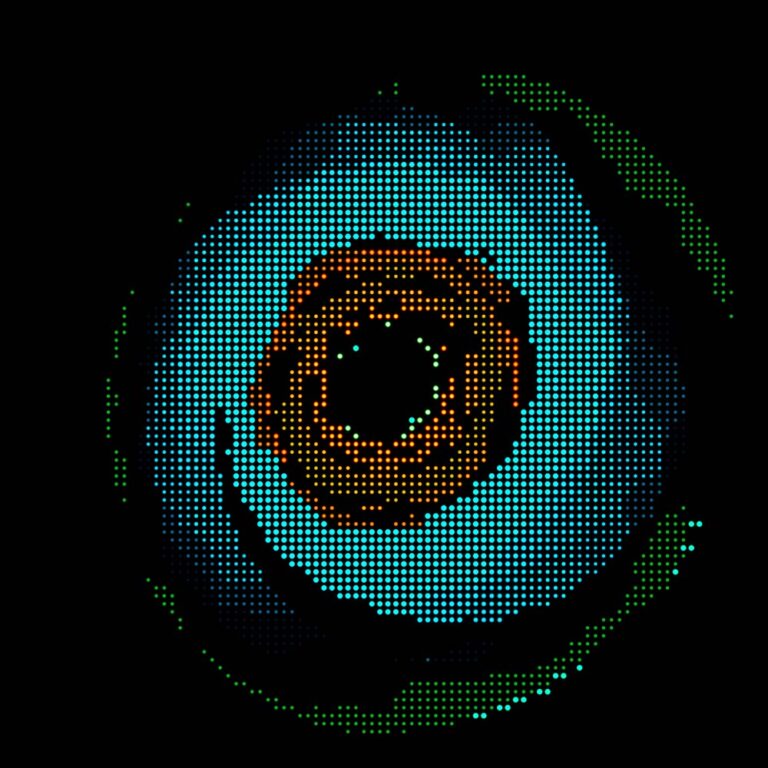
Image credit: Semiconductor

We have been learning new animation software which we can realise in real-time. After years of quite laborious and time-consuming processes of requiring the rendering animations, it’s more immediate and feels closer to sculpting the light, with instant results to programming and manipulation. We’re pushing the technology to learn it’s limitations and find a space where our own language can emerge and we’re playing with some of the emission line data we have collected and learning about what it brings to the table both physically and conceptually. We’re also playing with introducing other external materials which guide and manipulate the light based on the capturing techniques scientists employ to study light emissions.

In February 2020 we headed back to Dundee to give a presentation on our artwork to the Dundee University Physics Colloquium and also probe Justyn on the spectra numerical data; what it is, how it exists and how we can access it. He talked us through how he’s creating software to compare information from the same target over periods of time, this is the key to resolving information about structures around young stars. The waveform plots flux or light intensity over light wave. Back in the studio we are accessing numerical waveform data for different targets and instruments and comparing, to get a good understanding of it. We’re gathering materials, data and techniques to experiment with in the studio, and this numerical data maybe a way to bring time into the process, using the flux to give rhythm….

Unknown 2 (1)

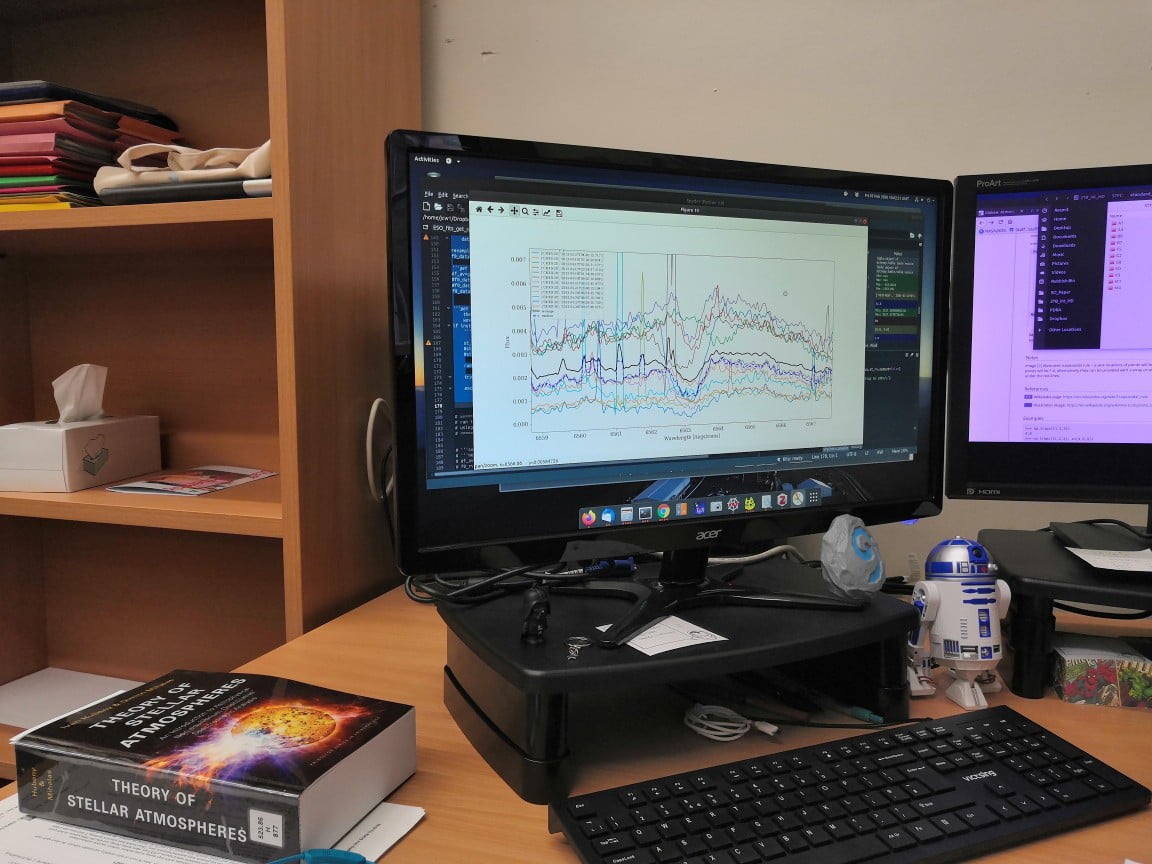
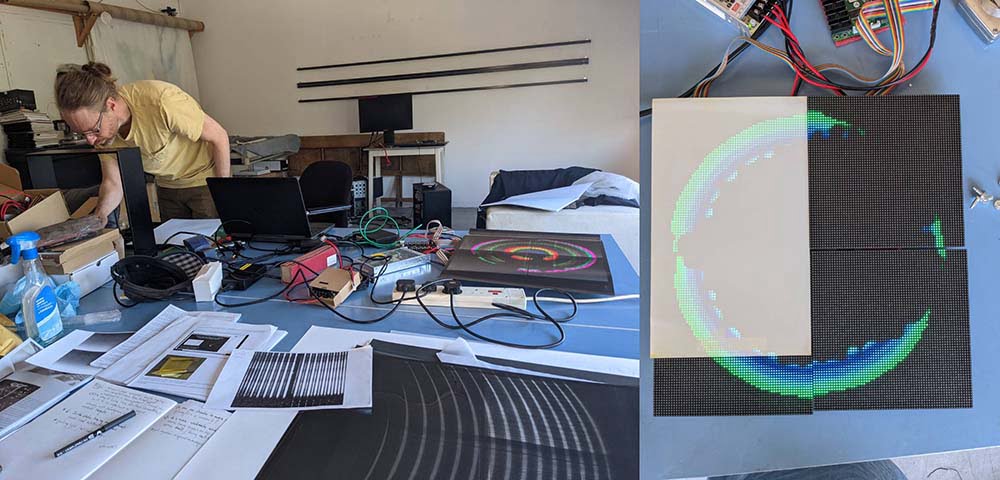
Justyn's Office/Image Credit Semiconductor
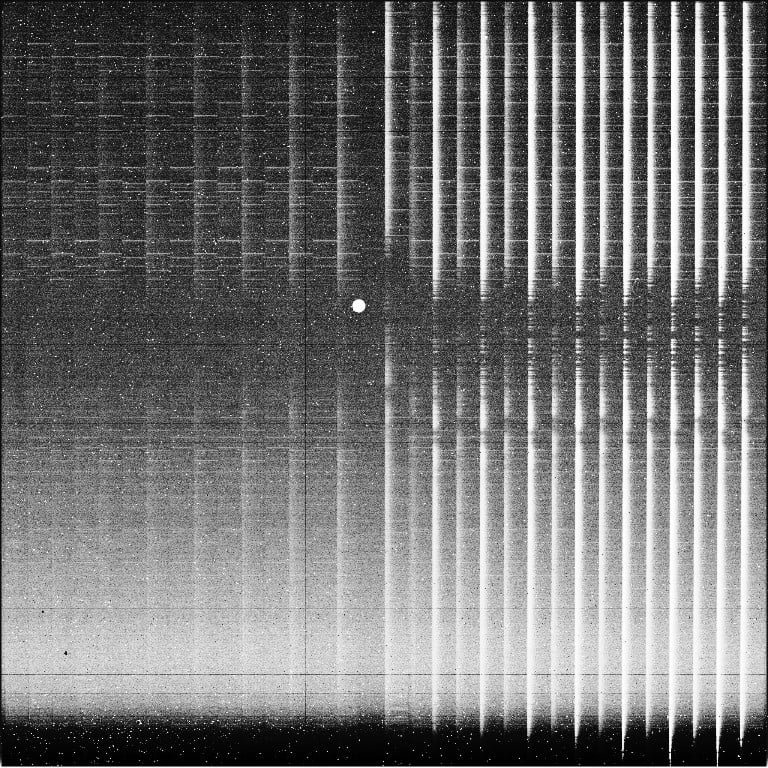
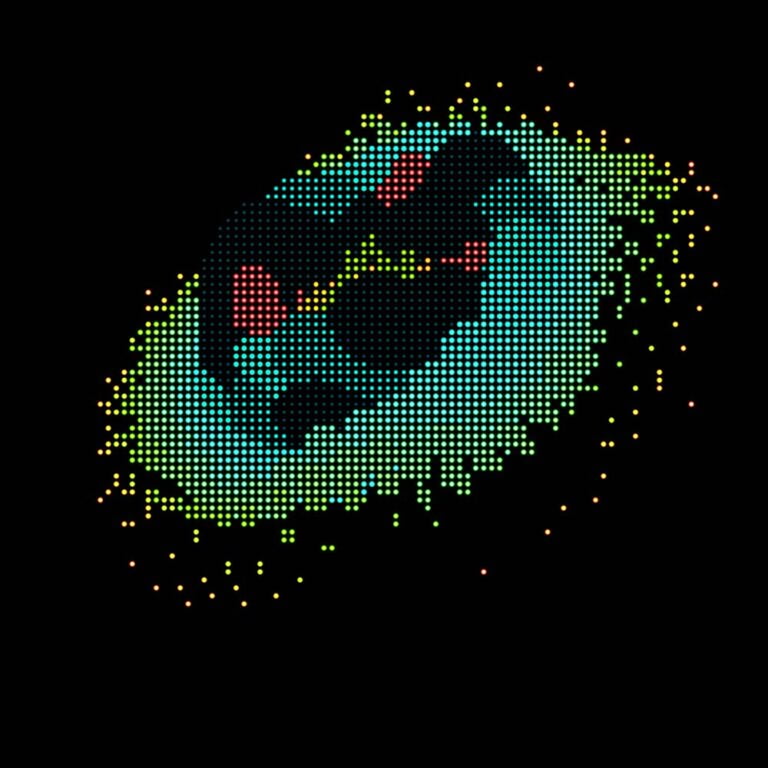
Unknown3

Image credit: ESO

Spectrograph of target Ex LUPI taken by the SINFONI (Spectrograph for Integral Observations in the Near Infrared) instrument at the European Space Observatory, Chile. Each instrument collates the dispersed light in a differing visual configuration, which lays the capturing process bare.

We have been exploring the European Space Observatory (ESO) data archives, accessing and learning about the spectrograph data from a wide range of ESO spectroscopes. This has involved trawling through archives and learning about the different techniques for presenting spectroscopic information collected of light from forming stars and planets, as visual data.
 

We have been creating a log of observatories, instruments, calibration processes, spectrograph techniques and targets used by Dundee so we can refer back and be methodical in our approach to potentially working with some or any of the data and processes in the resulting artwork.

We have been busy in our studio researching the science and technologies behind spectroscopy and more specifically the spectroscopic instruments whose data the scientists analyse in their research. These include the HARPS and FEROS spectroscopes, located at La Silla Observatory, Chile. (We were due to visit these in November 2019 for another project, which was quite serendipitous, but it was unfortunately cancelled due to the Chile uprising.) It’s quite easy to access all the hardware and technical documents once you start searching and they’re invaluable for getting a thorough understanding. We’ve been researching waveguides, prisms and optics, ways of guiding, dispersing and projecting light. We like to thoroughly pick apart the scientific and technical process as part of our research not only to get a good understanding of the subject we are working with but to have a good handle on the raw materials to build with, from the ground up.
 

We have been creating a log of observatories, instruments, calibration processes, spectrograph techniques and targets used by Dundee so we can refer back and be methodical in our approach to potentially working with some or any of the data and processes in the resulting artwork

FEROS Instrument

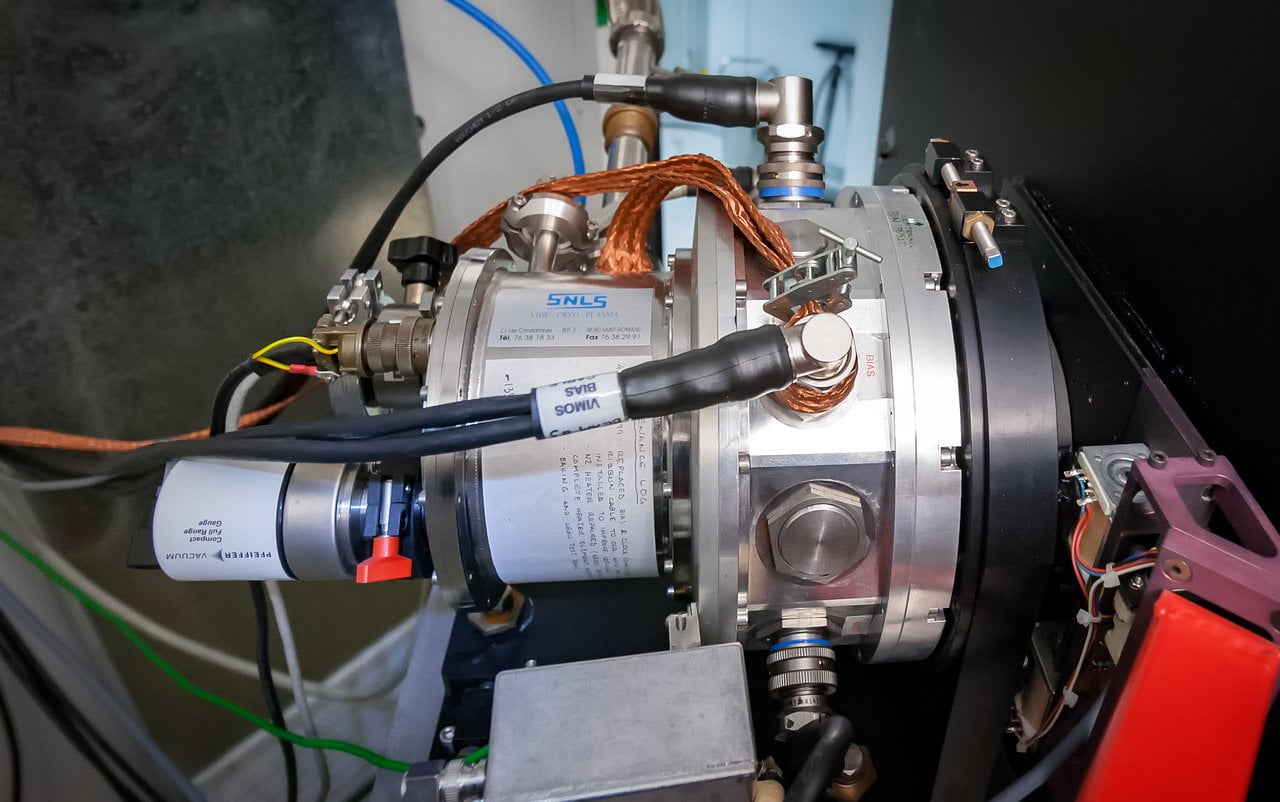
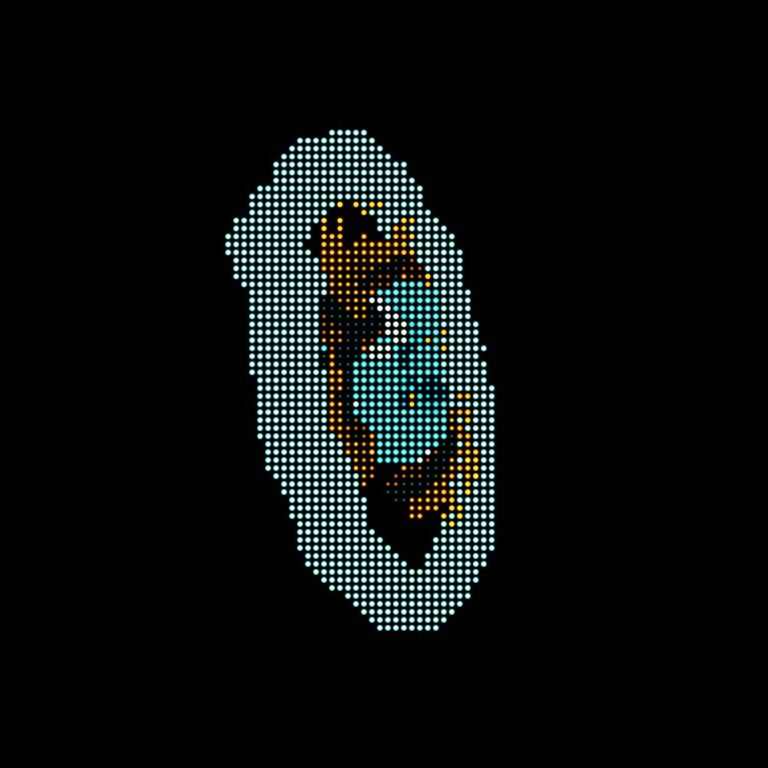
The Fiber-fed Extended Range Optical Spectrograph (FEROS) credit: ESO

Unknown (1)

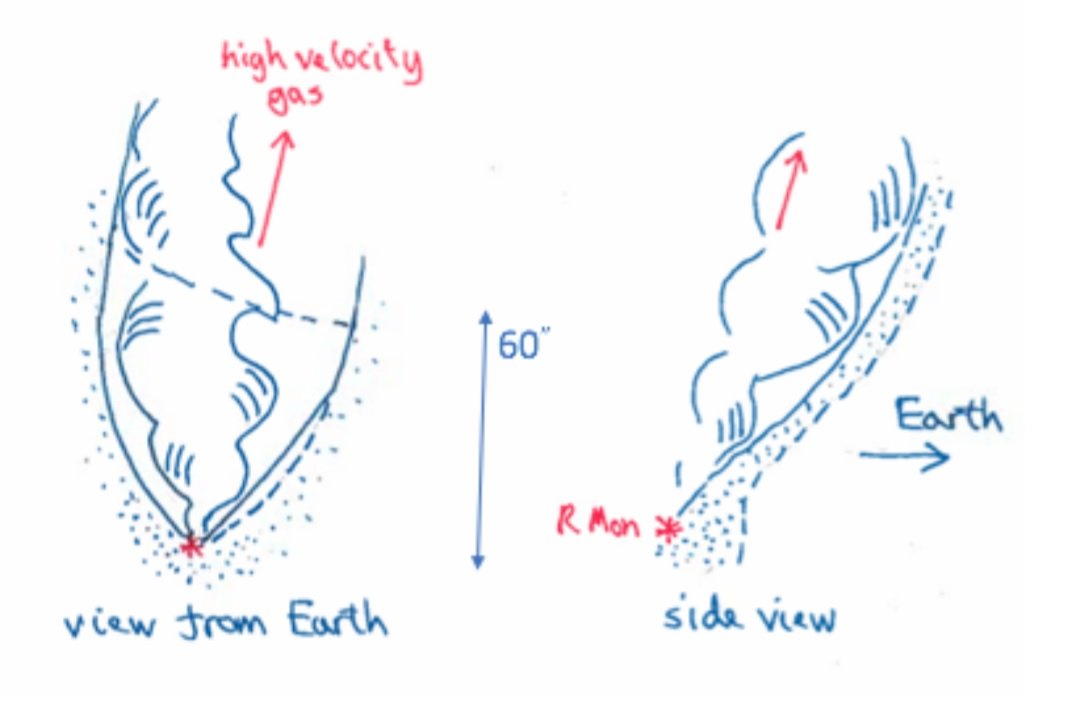
Credit: John Lightfoot

We were drawn to this image which Aurora used in one of her presentations, showing how ‘shadows cast by material very close to a star can be projected onto the surrounding nebula as if it were a giant screen’, we are shown a ‘view from Earth’ and a ‘side view’ from some position in space. As artists, we like to consider our viewpoint as humans, whether it’s down to our physical positioning bound on planet Earth rotating the Sun, or our perceptive limitations in only being able to see a portion of light waves for example. We reflect on how these impact our experiences of the physical world, this often involves stepping outside of ourselves or unknowing.

During September 2019 we visited the Planet-Disk Connection team in Dundee to get an overview of the work they do exploring planet formation environments. As well as trying to absorb the overall scientific and technological approach, we filtered areas of specific personal interest to research in more detail; the methods used to capture light from distant stars, the processes it goes through via layers of physical translation, the data that is produced, what the data can tell us and how the team are employing time in their observations. In our artworks we’re interested in creating experiences of the matter being studied framed through the scientific and technological devices that are used to study it. We do this to not only explore the capacity of humankind to create an understanding of the physical world but to reflect on our place in it.